Data Atlas
Data Visualization
Apr–May 2023
8 x 11"
Illustrator, InDesign
Apr–May 2023
8 x 11"
Illustrator, InDesign
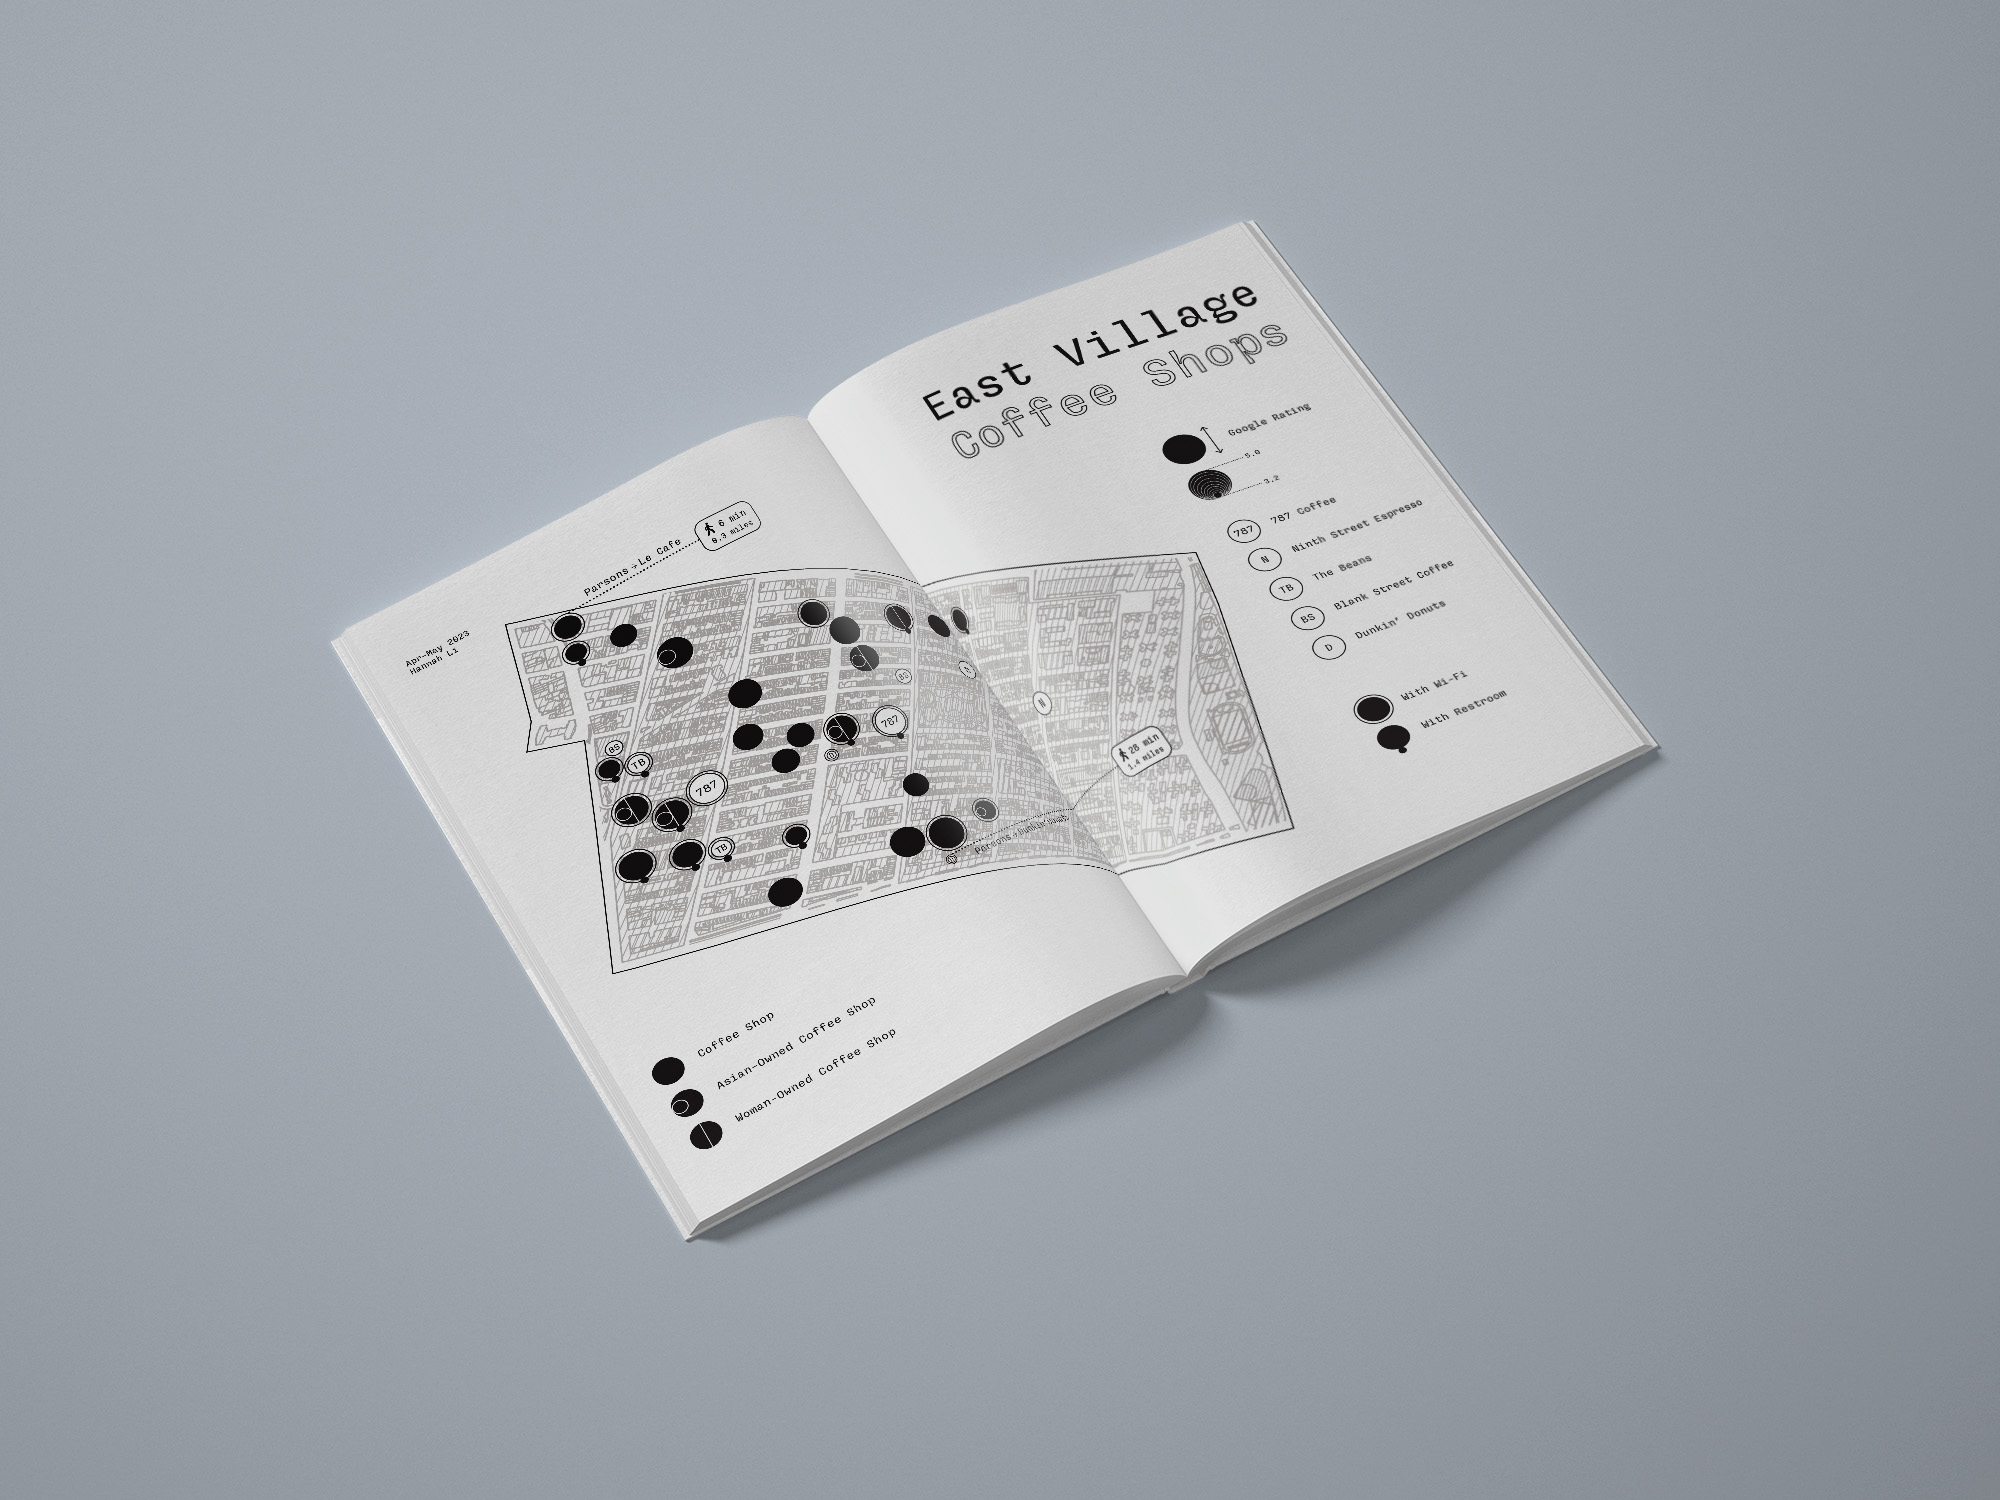
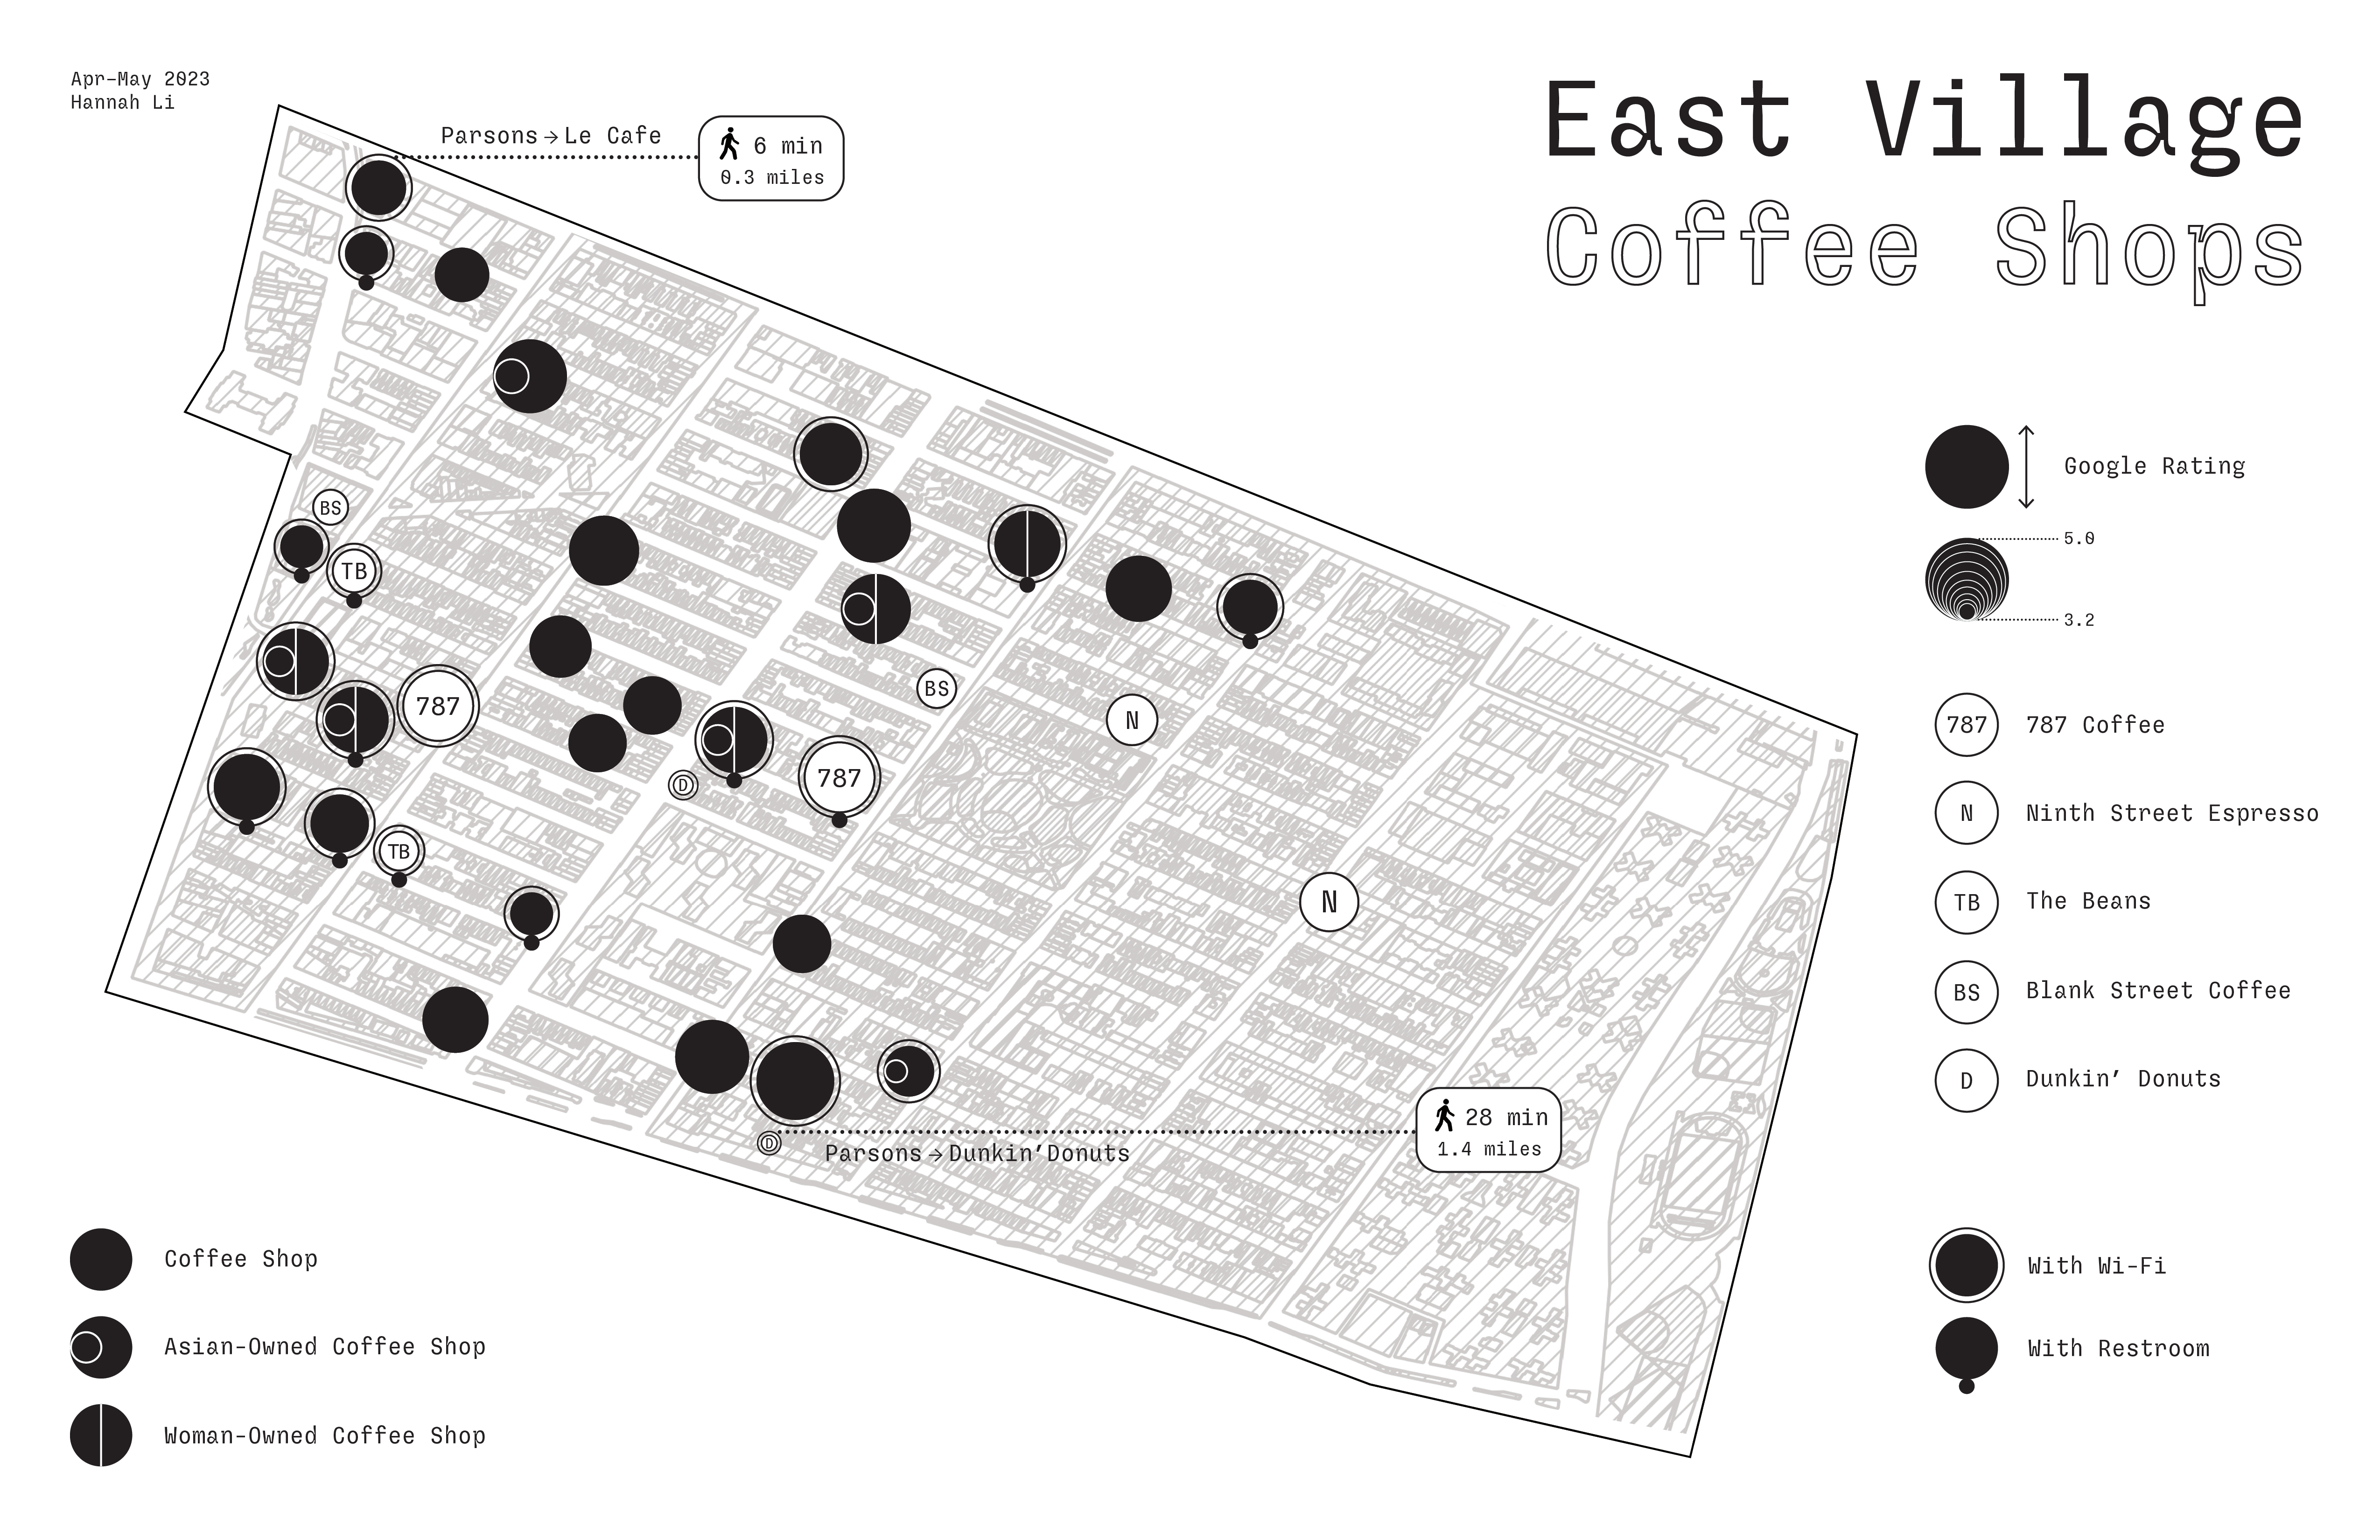
Visualizing data about East Village, focusing on its coffee shops. I chose to collect data about coffee shops in East Village because I was intrigued by the unique coffee culture and vibrant atmosphere of this neighborhood. By focusing on coffee shops, I aimed to explore the diverse offerings, trends, and characteristics of East Village coffee shops.
Through the process of designing a symbology system, graphics and composing layouts, I was able to visually depict my findings and present them in an engaging and informative manner. The final product consists of three spreads, featuring 20 data sets in total.
Through the process of designing a symbology system, graphics and composing layouts, I was able to visually depict my findings and present them in an engaging and informative manner. The final product consists of three spreads, featuring 20 data sets in total.


